Spectral characteristics
Guanfacine hydrochloride (GFN) does not exhibit significant native fluorescence under the studied conditions, which necessitates derivatization for its spectrofluorimetric determination. Upon reaction with 4-chloro-7-nitrobenzofurazan (NBD-Cl) in alkaline medium, a highly fluorescent derivative was formed. The emission spectrum of the reaction product showed a well-defined maximum at 535 nm when excited at 466 nm, whereas the reagent blank displayed negligible fluorescence under the same conditions (Fig. 2). This confirms the successful formation of a fluorescent NBD-derivative and demonstrates the selectivity of the proposed method. The observed fluorescence can be attributed to the formation of a highly conjugated NBD-GFN derivative following nucleophilic substitution of the chlorine atom in NBD-Cl by the amino group of guanfacine. The resulting product exhibits enhanced rigidity and extended π-electron delocalization, leading to a significant increase in fluorescence intensity. The excitation and emission wavelengths obtained are consistent with those reported for NBD-derivatives of other amine-containing compounds, further supporting the proposed reaction mechanism15,16.

Fluorescence spectra of the NBD-GFN derivative.
Reaction mechanism
The reaction between GFN and NBD-Cl proceeds via a nucleophilic substitution mechanism in alkaline medium. Under these conditions, the amino group of guanfacine becomes deprotonated, increasing its nucleophilicity. Nucleophilic nitrogen attacks the electron-deficient carbon atom bearing the chlorine substituent in NBD-Cl, resulting in the displacement of chloride ion and formation of a stable NBD-GFN derivative (Fig. 3). This derivatization step introduces a strong fluorophore into the molecular structure, thereby enabling sensitive spectrofluorimetric detection. Enhanced fluorescence is mainly due to the electron-withdrawing nitro group and the rigid benzofurazan moiety of NBD, which promote efficient radiative transitions.
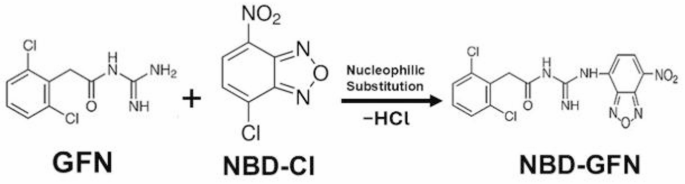
Suggested reaction pathway of GFN with NBD-Cl.
Optimization of experimental conditions
The experimental variables affecting the formation and stability of the fluorescent product were systematically investigated to achieve maximum sensitivity.
Influence of buffer pH and buffer volume
The nucleophilic substitution reaction between NBD-Cl and amine-containing compounds is favored under alkaline conditions. Accordingly, the effect of pH on the fluorescence response of the GFN-NBD derivative was systematically examined using borate buffer solutions over the pH range of 7–10. The results indicated that maximum fluorescence intensity was achieved at pH 9 (Fig. 4a), which was therefore selected as the optimum pH for subsequent experiments. The effect of buffer volume was also evaluated by varying the volume of pH 9 borate buffer. An increase in fluorescence intensity was observed up to 1.25 mL, beyond which no further improvement was noted, indicating that this volume is sufficient to maintain the optimal reaction environment. It is well recognized that NBD-Cl undergoes hydrolysis under alkaline conditions, leading to the formation of NBD-OH, which contributes to background fluorescence. To minimize this interference, the reaction mixture was acidified after completion of the reaction and cooling, using 1 mL of 2 M hydrochloric acid. This step effectively reduced the contribution of NBD-OH and enhanced the selectivity of the measurement.

Optimization studies for GFN reaction with NBD-Cl.
Effect of NBD-Cl volume
The influence of the reagent concentration was investigated by varying the volume of a 0.2% (w/v) NBD-Cl solution. The fluorescence intensity of the formed derivative increased with increasing reagent volume, reaching a maximum at 1.5 mL (Fig. 4b). Further increases did not result in significant enhancement, and therefore 1.5 mL was selected as the optimal volume to ensure complete reaction without excess reagent interference.
Effect of reaction temperature and heating time
The derivatization reaction between NBD-Cl and amines is kinetically slow at room temperature and typically requires elevated temperatures to proceed efficiently. The effect of temperature was studied over the range of 50–100 °C. The fluorescence intensity of the GFN-NBD derivative increased with temperature, reaching a maximum at 80 °C (Fig. 4c), beyond which no significant improvement was observed. The influence of heating time was also investigated under the optimized temperature. The fluorescence signal increased progressively with time and reached its maximum after 25 min, indicating completion of the reaction. Prolonged heating did not improve the response, and thus 25 min was selected as the optimal reaction time.
Effect of diluting solvent
The choice of diluting solvent can significantly influence the fluorescence characteristics of the formed derivative. Therefore, different solvents, including water, dichloromethane, methanol, ethanol, acetone, and acetonitrile, were evaluated. Among the tested solvents, water provided the highest fluorescence intensity (Fig. 4d), which may be attributed to its compatibility with the reaction medium and reduced quenching effects. Consequently, water was selected as the diluting solvent for all subsequent measurements.
Method validation (ICH Q2-R1)
Linearity and range
The linearity of the proposed spectrofluorimetric method was evaluated by correlating the measured relative fluorescence intensity of the GFN-NBD derivative (after blank correction) with the corresponding drug concentrations. A direct proportional relationship was observed over the concentration interval of 50–500 ng/mL. The calibration plot exhibited excellent linear behavior, with a coefficient of determination (r²) of 0.9995, confirming the reliability of the method within the studied range. The corresponding regression parameters are summarized in Table 1.
Limits of detection and quantitation
The sensitivity of the method was assessed through the estimation of the limits of detection (LOD) and quantitation (LOQ). These parameters were calculated based on the standard deviation of the response (σ) and the slope (S) of the calibration curve, following the ICH-recommended equations:
$$LOD{\text{ }} = {\text{ }}3.3{\text{ }}\sigma /S$$
$$LOQ{\text{ }} = {\text{ }}10{\text{ }}\sigma /S$$
The standard deviation (σ) was estimated as the standard deviation of the residuals of the calibration curve, constructed from n = 3 independent measurements. The calculated values, presented in Table 1, indicate the high sensitivity of the developed method, enabling reliable quantification of GFN at low concentration levels.
Accuracy and precision
The accuracy and precision of the method were investigated using three concentration levels within the working range (100, 300, and 400 ng/mL). Each level was analyzed in triplicate within the same day to evaluate repeatability, and the procedure was repeated over three consecutive days to assess intermediate precision. Accuracy was expressed in terms of percentage recovery (%R), while precision was evaluated as relative standard deviation (%RSD). The results obtained (Table 2) demonstrated that the method provides consistent and accurate measurements, with acceptable variability and recoveries close to 100%.
Robustness
The robustness of the proposed procedure was examined by introducing minor deliberate variations in key experimental conditions. A fixed concentration of GFN was analyzed while varying one parameter at a time, including slight changes in pH, reagent volume, and reaction time, while keeping other conditions constant. The recovery values obtained under these modified conditions remained within acceptable limits, as shown in Table 3, indicating that the method is sufficiently robust and not significantly affected by small operational changes.
Selectivity and application to pharmaceutical formulation
The selectivity of the method was confirmed through its successful application to the determination of GFN in pharmaceutical dosage forms without interference from commonly encountered excipients. Specificity was further evaluated by examining the potential interference of common excipients present in the Intuniv® formulation, namely lactose monohydrate, microcrystalline cellulose, povidone, crospovidone, hypromellose, colloidal silica, and polysorbate 80. Each excipient was added in excess (10- to 50-fold relative to GFN) to a fixed GFN concentration of 300 ng/mL, and the fluorescence intensity was measured under the optimized conditions. None of the tested excipients produced a significant deviation in the fluorescence signal of GFN, with percent recoveries ranging from 98.87% to 100.69% and %RSD values not exceeding 1.05% (Table 4), confirming the absence of excipient interference and the suitability of the method for direct application to the tablet matrix without prior separation. The absence of matrix interference was further verified using the standard addition technique, which yielded satisfactory recovery values. In addition, the analytical performance of the proposed method was statistically compared with that of a previously reported spectrofluorimetric method13, based on the derivatization of guanfacine with benzoin in alkaline medium in the presence of β-mercaptoethanol and sodium sulfite, using Student’s t-test and F-test at a 95% confidence level. The calculated values (Table 5) were found to be lower than the corresponding theoretical values, indicating no significant difference between the two methods in terms of accuracy and precision.
Comparative evaluation with reported method
A critical comparison between the proposed method and the reported spectrofluorimetric method13 was conducted with respect to analytical sensitivity and environmental benignity (Table 6). From a sensitivity standpoint, the proposed method exhibits a clear analytical advantage, achieving LOD of 13.80 ng/mL compared to 20 ng/mL for the reported method. This represents an approximate 1.45-fold improvement in detection capability, which can be attributed to the superior fluorogenic behavior of NBD-Cl.
In terms of green analytical performance, the proposed method demonstrates a significantly improved environmental profile. According to the Analytical Eco-scale, the proposed method achieved a score of 89, compared to 81 for the reported method13. This 10-point difference is substantial and reflects a meaningful reduction in environmental burden. The higher score of the proposed method is primarily attributed to the avoidance of hazardous reagents such as β-mercaptoethanol, which contributes significantly to the penalty points. Instead, the proposed method employs relatively safer reagents, resulting in lower overall environmental impact. Further support is provided by the AGREE assessment, where the proposed method achieved a score of 0.68, whereas the reported method13 showed a lower score of 0.63. This difference confirms the superior compliance of the proposed method with the principles of green analytical chemistry. The higher AGREE score is mainly associated with improved reagent safety, reduced chemical hazard, and better overall greenness metrics. It is noteworthy that both methods exhibit comparable energy consumption, instrumentation requirements, and waste generation; therefore, the observed improvement in greenness is directly attributable to rational reagent selection rather than procedural differences. Overall, the proposed method offers a dual advantage of enhanced sensitivity and superior environmental benignity, supported by both Eco-scale and AGREE metrics. These findings highlight the method as a more advanced, efficient, and greener alternative for the determination of guanfacine in pharmaceutical analysis.
While LC-MS/MS methods reported for GFN offer markedly superior sensitivity, for instance, LLOQ values in the low picogram-per-milliliter range have been achieved for GFN quantification in biological matrices9, such techniques require expensive triple-quadrupole instrumentation, skilled personnel, and labor-intensive sample preparation (e.g., liquid–liquid extraction), rendering them less accessible for routine pharmaceutical quality control settings. The proposed spectrofluorimetric method, by contrast, achieves nanogram-per-milliliter sensitivity (LOD 13.80 ng/mL) sufficient for the analysis of GFN in tablet formulations, using inexpensive, widely available instrumentation and a straightforward derivatization procedure without extraction or cleanup steps. This positions the proposed method as a practical, cost-effective, and environmentally friendly alternative for routine QC laboratories, where LC-MS/MS-level sensitivity is not required, while chromatographic and mass spectrometric methods remain the methods of choice for trace-level bioanalytical applications such as pharmacokinetic studies in plasma.
It should be noted that the proposed method was developed and validated solely for the quantification of GFN in pharmaceutical tablet formulations and has not been evaluated for application to biological matrices such as plasma or urine. Extension to bioanalysis would require additional validation steps, including a protein precipitation or extraction protocol to isolate GFN from the matrix, assessment of matrix effects and selectivity against endogenous plasma/urine components and metabolites, and re-evaluation of sensitivity, since therapeutic plasma concentrations of GFN are typically in the low nanogram- to picogram-per-milliliter range6,7,8,9,10, which may approach or fall below the LOD of the present method. Consequently, the method in its current form is recommended for routine pharmaceutical quality control applications rather than pharmacokinetic or bioanalytical studies, for which the LC-MS/MS methods discussed above remain more appropriate.