Energy dispersive x-ray spectroscopy (EDX)
Figures 4 and 5 present the energy-dispersive X-ray spectroscopy (EDX) results for reference sample B1, used to determine the elemental composition of the polymer matrix before PbO incorporation, and for sample B5 after PbO addition. EDX analysis was done on a localized surface region, so the measured Pb content is more about that specific surface composition rather than the overall bulk state of the film. The elemental makeup of the neat polymer film, B1, was first found experimentally via EDX analysis. These values were then treated as a kind of reference point when looking at the nanocomposite set (B2–B5), where PbO was included at different levels 7.14, 13.33, 18.75 and 23.53 wt%, respectively. After that, for every sample the elemental compositions were estimated by taking into account the theoretical PbO fraction and then rescaling the total elemental weight percent so it sums to 100%, to keep the whole series consistent. To double check that the filler truly got incorporated, another EDX spectrum was taken for the B5 sample, and it showed a clear Pb signal, which confirms the existence of lead species inside the polymer matrix. Overall, the findings point to a steady, almost monotonic rise of Pb content as the PbO loading increases, which supports compositional tuning and suggests that the inorganic filler is effectively embedded in the polymer system.
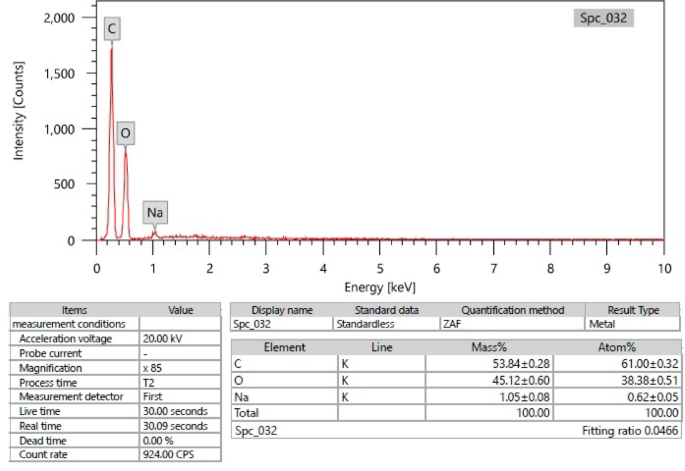
EDX spectrum of sample B1.
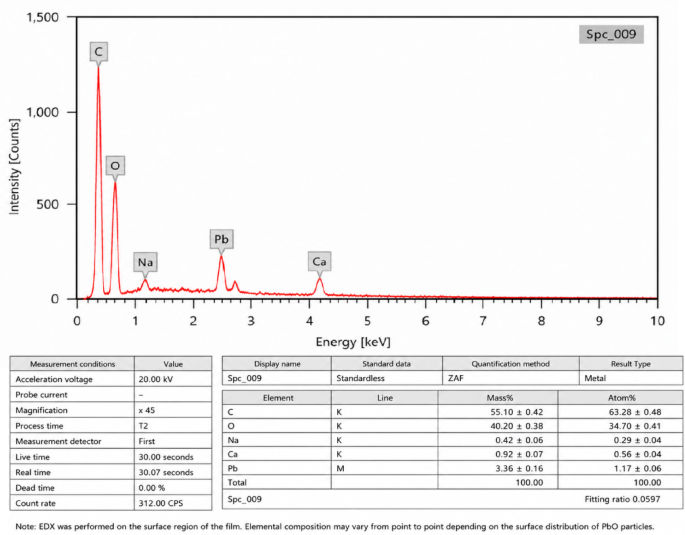
EDX spectrum of sample B5.
X-ray diffraction
The XRD patterns of the reference composite B1 and PbO-reinforced composite B5 are depicted in Fig. 6. The diffraction halo around 2θ ≈ 20° in the B1 pattern confirms the semi-crystalline nature of the polymer matrix. When adding 40 wt.% nano-PbO (B5), a number of sharp diffraction peaks are developed, confirming crystalline PbO. The first peak, with its major intensity at about 2θ ≈ 29°, is consistent with the (101) plane. Other smaller but detectable peaks might correspond to the planes of (002), (110), and (112). These peaks correlate well with the standard diffraction data for tetragonal PbO as recorded in JCPDS card no. 85-0711. With increasing intensity and sharpness, peaks can be recognized, which contribute to the due improvement in crystallinity due to higher loading of PbO and its uniform dispersion within the polymer matrix.
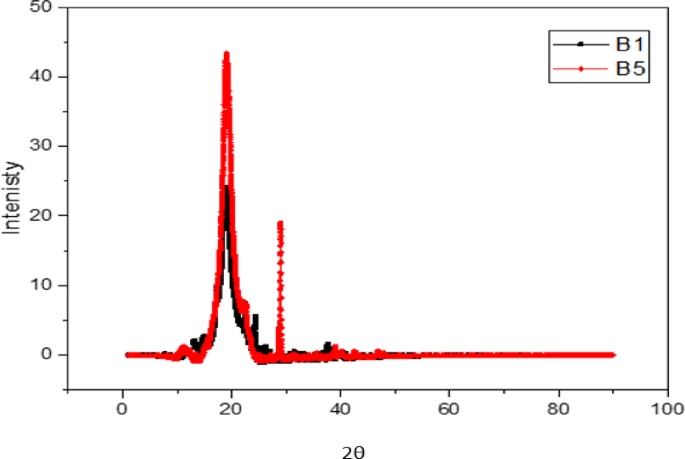
Comparison of XRD spectra for B1 and B5 samples.
Scanning electron microscopy (SEM) analysis
The SEM pictures show how the two polymer samples differ in their morphology. With no discernible inclusions, agglomerates, or phase separation, the lead-free polymer’s surface is smooth and uniform, as shown in Fig. 7. With no inorganic fillers, this homogeneity represents a pure polymeric matrix. While physically stable, the lack of high atomic number elements may restrict its use in radiation shielding. On the other hand, Fig. 8, which corresponds to the polymer sample (B5) loaded with 40 weight percent PbO, exhibits a markedly changed morphology with finely dispersed PbO particles throughout the matrix; the distribution of PbO appears highly uniform, with no evidence of particle agglomeration or interfacial detachment, suggesting strong interaction and compatibility between the inorganic filler and the polymer phase; this well-dispersed microstructure is especially beneficial for radiation shielding applications, as it eliminates localized weaknesses in the material and promotes consistent attenuation behavior. The addition of PbO clearly improved the microstructural features of the composite, transforming it from a homogenous organic phase to a composite material with increased density and atomic number factors that are essential for effective radiation attenuation.
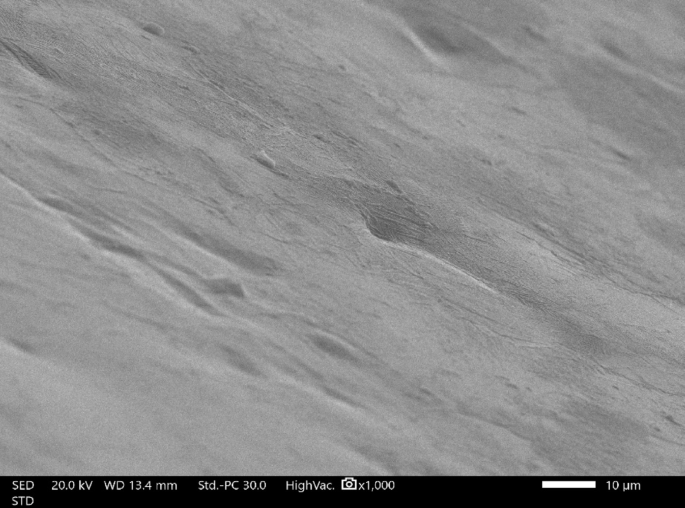
SEM image of the undoped bulk sample (B1) surface showing a relatively homogeneous morphology with no visible agglomerations.
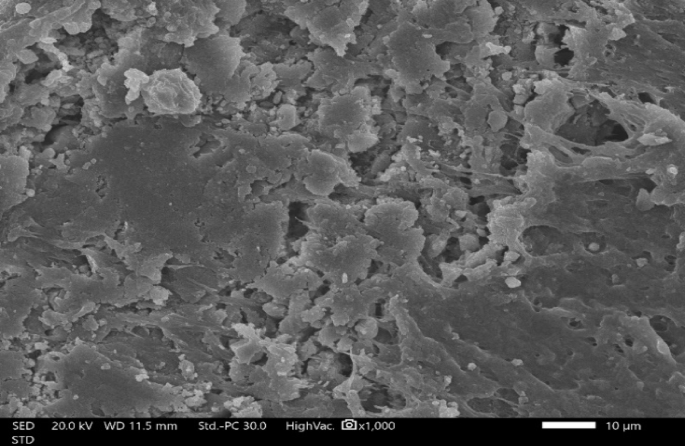
SEM image of the Pb-doped sample (B5) showing surface morphology changes with noticeable grain clustering, indicating the influence of lead doping on the microstructure.
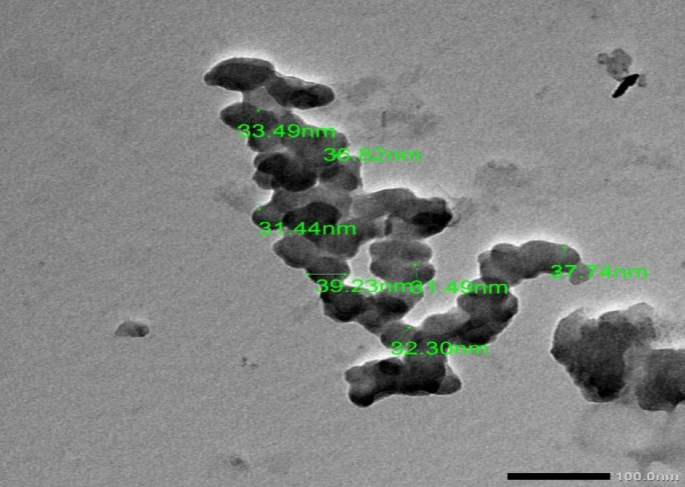
TEM image showing the morphology and particle size distribution of the prepared nanoparticles (~35 nm average).
Transmission electron microscopy (TEM) analysis
The TEM micrograph displays the synthesized nanoparticles’ morphology. With a distinct propensity to aggregate, the particles have an approximately spherical to irregular shape. The graphic shows the particle size distribution, which has an average size of about 35 nm and ranges roughly from 31 to 39 nm (Fig. 9). This dimension at the nanoscale verifies that the nanoparticles were successfully created. The high surface energy and robust interparticle interactions are responsible for the minor size fluctuations and partial aggregation seen. All things considered, the TEM data show that the particles are nanoscale and are in line with the anticipated structural features.
Thermal analysis
Thermal stability is characterized by the weight loss of the sample after heating in the temperature range of 25–500 °C. Thermal data of composite films 4 and 5 containing 7.14 %, 13.33%, 18.75%, and 23.53% of PbO were examined utilizing thermogravimetric analysis (TGA), derivative thermogravimetric analysis (DrTGA), and differential thermal analysis (DTA) methods under a nitrogen atmosphere. The TGA/DrTGA profile curves of composite film 4, Fig. 10B1, displayed successive decomposition in three cumulative stages at 241 °C (17.68% wt loss), 401 °C (85.83% wt loss), and 681 °C (22.23% wt loss), leaving at >700 °C a 30.21% value of the sample weight as a residue. The DTG showed a strong main exotherm at 323 °C and two other weak endotherms at 200 °C and 407 °C. The DSC spectrum of 4, Fig. 11B1, exhibited three endothermic peaks at 204 °C (energy 53.68 J/g), 322 °C (energy 345.9 J/g), 412 °C (energy 13.33 J/g), and one exotherm peak at 480 °C (energy 94.59 J/g) due to elimination of side chain substituents and subsequent morphological changes. In particular, the DSC spectrum displays one exothermic degradation peak. This is ascribed to the slow to medium crystallization, and the consequent evolved heat flow over a temperature range was lost in the baseline. The TGA/DrTGA profile curves of the composite containing 7.14% PbO film 5, Fig. 10B2, displayed three decomposition exotherms at 187°C (10.17% wt loss), 345°C (63.73% wt loss), and 684°C (29.28% wt loss). The TGA software reported an apparent final mass value of −5.16 wt% at 693°C. Since a negative residual mass is physically impossible, this value is attributed to baseline drift and instrumental correction effects at high temperatures rather than a real residue. Therefore, the final residual mass can be considered approximately zero within the experimental uncertainty. The DTG showed a weak broad exotherm at 200°C, a strong main exotherm at 271.9°C, and two other endotherms at 411.8 °C and 661.8 °C. The DSC spectrum of 5 (7.14% PbO content), Fig. 11B2, exhibited three endotherms at 64 °C (energy 104.1 J/g), 215 °C (energy 15.83 J/g), 274 (energy 375.0 J/g), and two exotherms at 372 °C (energy 20.92 J/g) and 500 (energy 49.2 J/g). The TGA/DrTGA profile curves of the composite containing 13.33% PbO film 5, Fig. 10B3, displayed three decomposition peaks at 133 °C (4.41% wt loss), 211 °C (4.84% wt loss), 329 °C (49.87% wt loss), and 682 °C (10.11% wt loss), leaving a 9.75% value at 692 °C as residue. The DTG showed a weak broad exotherm at 141.29 °C, a strong main exotherm at 277.7 °C, and a weak endotherm at 425.9 °C. The DSC spectrum of 5 (13.33% PbO content), Fig. 11B3, exhibited three endotherms at 39 °C (energy 22.58 J/g), 216 (energy 16.83 J/g), 281 sharp endotherm (energy 303.7 J/g), an endotherm at 401 C (energy 20.32 J/g), and three additional exotherms at 462 (energy 5.43 J/g), 490C (energy 3.76 J/g), and 642 (energy 55.25 J/g). The TGA/DrTGA profile curves of the composite containing 18.75 % PbO film 5, Fig. 10B4, displayed three decomposition peaks at 207 °C (7.91 % wt loss), 360 °C (51.62 % wt loss), and 684 °C (20.33 % wt loss), leaving a 17.77 % value at 693 °C as residue. The DTG showed a weak broad exotherm at 200 °C, a strong main exotherm at 283.7 °C, and a weak endotherm at 420.9 °C. The DSC spectrum of 5 (18.75% PbO content), Fig. 11B4, exhibited three endotherms at 51 °C (energy 11.01 J/g), 219 (energy 17.87 J/g), 287 sharp endotherm (energy 363.7 J/g), an endotherm at 405 C (energy 23.76 J/g), an exotherm at 480 C (energy 16.73 J/g), and an exotherm at 527 C (energy 16.73 J/g). The TGA/DrTGA profile curves of the composite containing 23.53% PbO film 5, Fig. 10B5, displayed three decomposition peaks at 209 °C (8.45 % wt loss), 347 °C (54.18 % wt loss), and 687 °C (23.80 % wt loss), leaving a 11.87 % value at 693 °C as residue. The DTG showed a weak broad exotherm at 185 °C, a strong main exotherm at 283.9 °C, and a weak endotherm at 417.3 °C. The DSC spectrum of 5 (23.53 % PbO content), Fig. 11B5, exhibited three endotherms at 187 °C (energy 4.49 J/g), 217 °C (energy 6.78 J/g), 288 sharp endotherm (energy 296.4 J/g), and an endotherm at 669 °C (energy 20.09 J/g).
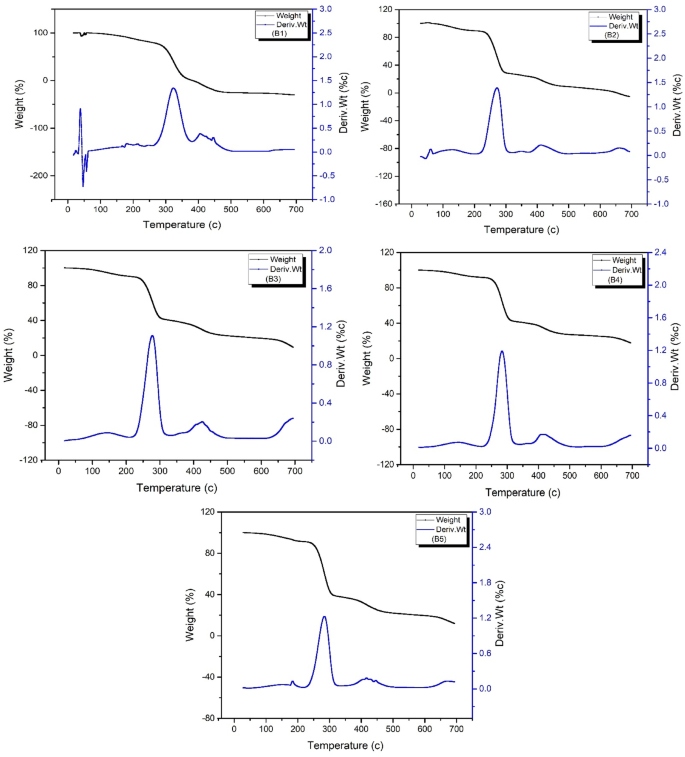
TGA/DTG thermograms of composite films.
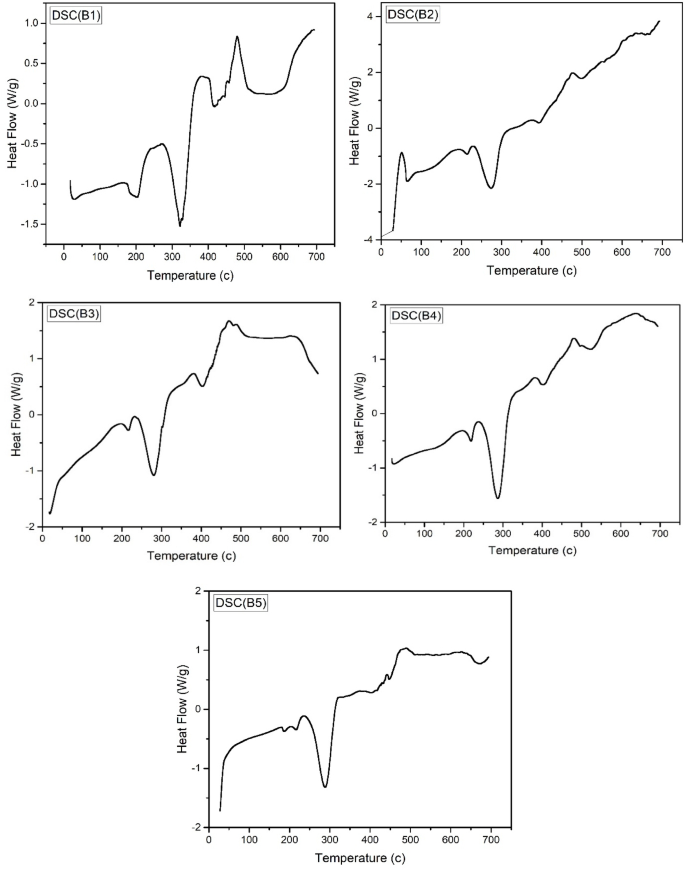
DSC thermograms of composite films.
Thermal studies of the composite films proved their unambiguous thermal stability. Heating the samples of films 4 containing 13.33% and 18.75 % PbO film (Fig. 10B3 and B4 up to 700 °C left 9.75 % and 17.77 % of the sample weights, respectively, as remaining metal oxide residues19. Interestingly, the TGA software reported an apparent final mass value of −5.16 wt% for the film containing 7.14% PbO (Fig. 10B2). Since negative residual masses are physically impossible, this value is attributed to baseline drift and instrumental correction uncertainties at high temperatures, and the actual residual mass is considered approximately zero within the experimental error. In contrast, the film containing 23.53% PbO (Fig. 10B5) retained 11.87 % of its original weight as residue at the end of the TGA run. As illustrated in Fig. 10, the thermal decomposition of all PVA/PVP-based films occurs through three degradation steps in the temperature range 207–401 °C, attributed to dehydration and degradation of other combined residuals of film ingredients12. Generally, for such polymeric compositions, at temperatures higher than 213 °C, the chain radical mechanism becomes relevant, and the melting of C–C or C–H bonds takes place13. The first degradation peak at approximately 133 °C was ascribed to the loss of contaminated moisture. The maximum degradation temperatures of the films were 401 °C, 345 °C, 329 °C, 360 °C, and 347 °C, respectively. Interestingly, the major degradation peaks of films containing PbO (Fig. 10B2–B5) were at temperatures lower than that of the neat polymeric sample 4 (Fig. 10B1). These results showed that the incorporation of different ratios of PbO into the polymeric mixture decreased the thermal resistance within the polymeric chain. The observed shifted thermal degradations can be attributed to the presence of metal oxide particles that inhibit the expected hydrogen bonding and other physical interactions between the polymeric chains and, consequently, negatively impact the thermal stability of films. Noteworthy, as reported in the literature, PbO nanoparticles were stable in a temperature range between room temperature to 1175 °C in air with the ramp rate of 10 °C min−120.
UV–vis characterization of composite films
Fig. 12 kind of shows the UV–vis absorbance spectra for the PVA/PVP/o-carboxymethyl chitosan/citric acid/PbO nanocomposites made with different PbO concentrations. The absorbance response is, in general, really affected by how much PbO you add, so you can see differences between the tested samples clearly. The B1 sample, that has no PbO at all, gives moderate absorbance values, and when you start adding PbO the optical absorption first goes up. In Fig. 12 it is clear that B3, with 13.33 wt.% PbO, reaches the highest absorbance across the whole wavelength area from 230 to 380 nm. This improvement is usually linked to the best dispersion of the PbO nanoparticles inside the polymer host, which means you get more active absorption spots and stronger coupling between the incoming photons and the composite skeleton. Adding PbO also brings extra electronic states that help the material take in photons, and then this supports better optical shielding. Still, when the PbO content is pushed higher than 13.33 wt.% (samples B4 and B5), the absorbance drops. One possible reason is that at higher filler levels the nanoparticles start to clump together, that kind of agglomeration reduces the real, effective surface area that photons can interact with, and it also weakens the absorption process. so, in summary, the B3 nanocomposite appears to have the best PbO amount for maximizing UV–vis absorbance, and it shows stronger optical attenuation compared to the other prepared samples.
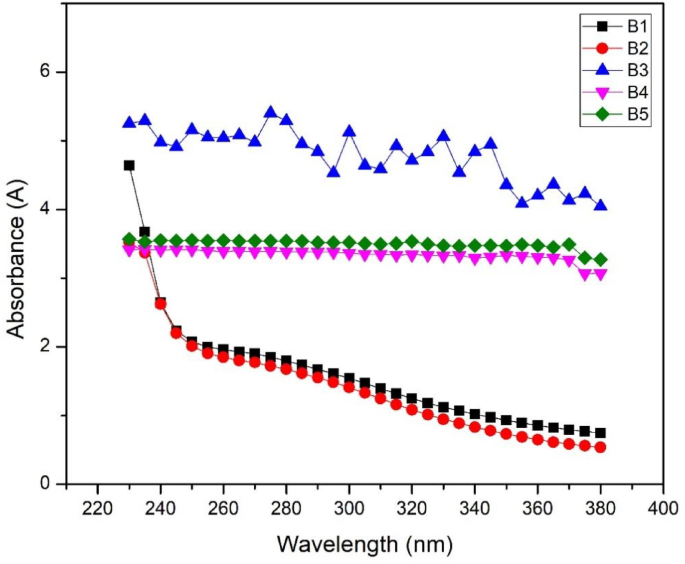
UV–vis characterization for the free polymer film (B1) and nanocomposite samples with varying additive concentrations (B2, B3, B4, B5).
Water vapor permeability (WVP)
The initial formulation was followed by the incorporation of lead oxide (PbO) in four film samples at different concentrations. The corresponding WVP values were 2.01×10⁻¹², 3.47×10⁻¹², 2.10×10⁻¹², and 1.46×10⁻¹²g/cm·s·Pa, respectively, as shown in Fig. 13, which are high when compared with the control film without PbO, where a WVP of 1.73×10⁻¹²g/cm·s·Pa was observed. These results indicate that PbO affected the water vapor barrier properties of films under concentration.
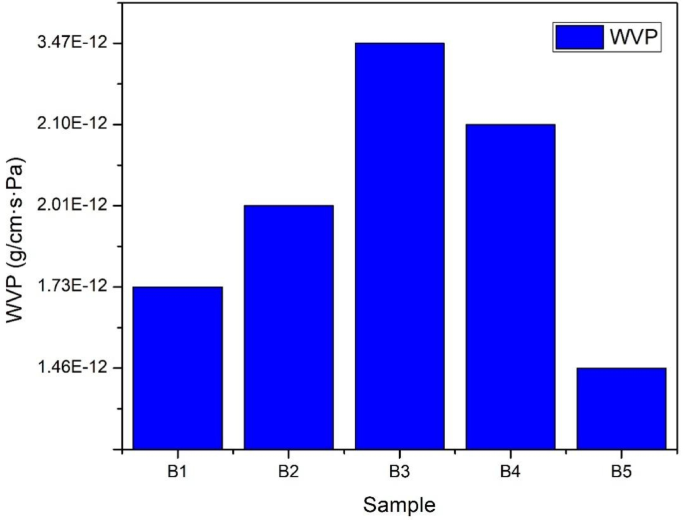
Water vapor permeability for the free polymer film (B1) and nanocomposite samples with varying additive concentrations (B2, B3, B4 and B5).
In three of the PbO-containing films, WVP values were higher than the control, which indicates that PbO at some concentrations might disturb the structural integrity of the polymer matrix. The cause could be either disruption in intermolecular hydrogen bonding or reduction of crosslink density, which could result in either more free volume or microstructural irregularities that allow more water vapor transmission. On the contrary, the film containing PbO with the lowest WVP (1.46×10⁻¹²g /cm·s·Pa) indicates that at an optimal concentration, PbO can actually improve the barrier properties of the structure. This improvement could be due to PbO, acting as an efficient filler, causing polymer chains to pack tighter and create less space between them. This indicates the dual role of PbO as a possible disruptor as well as an enhancer of water vapor barrier performance depending on its concentration. Hence, proper optimization of PbO amount should be extensively studied to achieve the required balance between structural integrity and barrier efficiency of the composite polymer films.
Total soluble matter (water absorption)
Figure 14 illustrates the variation in sample weight (g) for composites B1–B5 as a function of water immersion time (1–5 h) and after drying. It shows a steady increase in mass during immersion due to the water uptake and a considerable decrease after drying, thereby proving the reversibility of water absorption and retention behavior for each composite formulation. Water absorption behavior for the prepared composites (B1–B5) is shown in Fig. 15. All the samples demonstrated a rapid increase in water uptake during the first 2–3 h and gradual approach to saturation thereafter. Among the various formulations, B2 showed the maximum absorption of water (≈180%), indicating its higher hydrophilic nature or enhanced porosity compared to the other samples. B1, even though, showed comparatively higher absorption but remained slightly less than B2. On the contrary, B5 had the least uptake of water during the entire immersion time, which corroborates the composition working well, probably due to the inclusion of nano PbO and crosslinking agents for reducing the number of available pores and enhancing the water resistance. For B3 and B4, moderate absorption points toward partial enhancement of water barrier properties. in brief, the trends indicate that both increasing filler content and crosslinking density effectively inhibit water absorption and further moisture resistance of the composites.
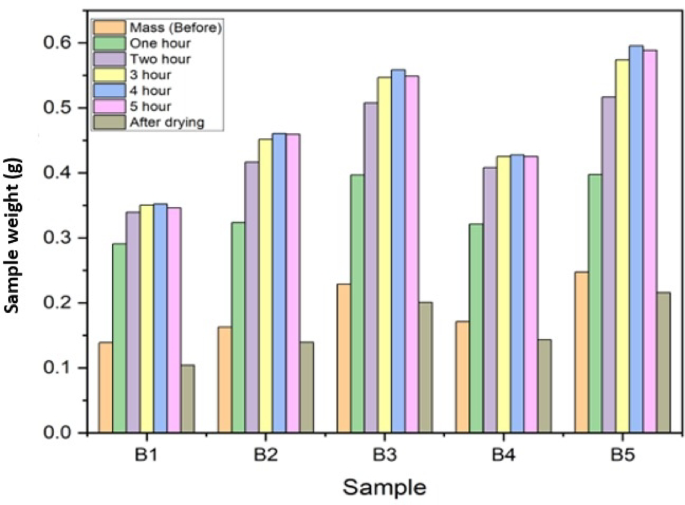
Variation in sample weight (g) for composites B1–B5 as a function of water immersion time (1–5 h) and after drying.

Total soluble matter (water absorption) for the free polymer film (B1) and nanocomposite samples with varying additive concentrations (B2, B3, B4, B5).
Soil burial degradation
The results revealed a remarkable loss in the original weight of the chitosan-containing plastic film samples for six months while in soil, with mass loss percentages ranging from 8.4 to 16.1 (Table 2). This loss can be attributed to partial biodegradation in natural environmental conditions, primarily due to chitosan’s presence in the film matrix. Chitosan is a naturally occurring polysaccharide derived from chitin that is very easy to biodegrade by microbes and enzyme activity, particularly by soil microorganisms like fungi and bacteria. These organisms possess the ability to produce their enzymes—namely chitinases and chitosanases that hydrolyze the glycosidic bonds within the chitosan backbone. Also, having added chitosan into the plastic matrix will change its physical and chemical properties towards a more hydrophilic and oxygen-permeable nature, encouraging microbial colonization and then enzymatic degradation. Variability in mass loss across samples may be due to differences in film thickness, local microenvironmental conditions, or heterogeneity in microbial activity within the soil. In summary, the findings would indicate that the inclusion of chitosan in plastic films could enhance biodegradation, as it is an encouraging approach for developing eco-friendly materials with less long-term ecological impact21.
Gamma-ray-shielding characteristics
The mass attenuation coefficient (MAC) represents a crucial criterion for assessing the radiation shielding capability of the plastic film under consideration. Hence, the mass attenuation coefficient (MAC) was determined experimentally using standard point sources that emit gamma rays with energies ranging from 0.0595 MeV to 1.3325 MeV. The experimental values of MAC were therefore compared with theoretical values obtained from the XCOM database. Both results, along with the computed deviation between experimental and theoretical values, are presented in Table 3. The percentage deviation was calculated using the following equation.
$${\text{Deviation}} \left( \% \right) = \frac{{\left| {MAC_{XCOM} – MAC_{EXP} } \right|}}{{MAC_{XCOM} }} \times 100$$
(10)
The results in Table 3, well they show this pretty clear strong dependence on photon energy and atomic number (Z) and density, plus the whole material microstructure and overall, the data keep showing this steady kind of drop in MAC as photon energy goes up, for all the samples B1–B5. Like, MAC goes down from the low–energy area 0.0595 MeV to the high–energy area 1.3325 MeV, which kind of lines up with the change in what interaction dominates: at low energies it’s mostly photoelectric absorption, then around intermediate energies it shifts toward Compton scattering, and then at higher energies there’s a bit of pair production (>1.022 MeV) in the mix22,23,24. So that overall inverse relationship between MAC and energy comes out, pretty much as expected; for instance in the most loaded nanocomposite B5, MAC drops from 1.3209 cm2/g at 0.0595 MeV to 0.0617 cm2/g at 1.3325 MeV, and for B1 through B4 you still see basically the same descending pattern, so this kind of “universal” energy dependence gets confirmed.
On the atomic number and density side, Table 3 also gives a systematic story: MAC rises when the filler content and density rise, starting at B1 (ρ = 1.250 g·cm⁻3) and reaching B5 (ρ = 1.572 g·cm⁻3). Here, the extra PbO loading makes the composite’s effective atomic number and electron density higher, so attenuation improves a lot, especially at low photon energies where the photoelectric effect is the main player. You can see that clearly in the 0.0595 MeV case: MAC jumps from 0.1822 cm2/g for B1 to 1.3209 cm2/g for B5. This is a strong sign that the high-Z PbO matters a lot for strengthening photon absorption; at intermediate energies, say 0.3560 and 0.6617 MeV, the sample to sample gap becomes less obvious, which fits with Compton scattering being more about electron density rather than atomic number, even though the higher-Z specimens still usually give better shielding.
For validation against theory, the XCOM values are treated as the bulk theoretical baseline, and the comparison indicates experimental MAC for the nanocomposites (B2–B5) are consistently higher than XCOM, with the positive deviation increasing as filler concentration increases, roughly in the 2–14% range. That suggests the nano-structuring is improving efficiency beyond what bulk expectations predict. This is plausibly tied to improved dispersion of PbO nanoparticles, less agglomeration, a larger interfacial area, and a more uniform electron density spread, all of which increase the chance of photon interaction. Meanwhile, the plain polymer film (B1) tracks XCOM more closely, so it behaves more like a bulk-like low-Z matrix. In the end, Table 3 basically confirms: MAC increases with atomic number and density, decreases with photon energy, and is noticeably boosted in the PbO nanocomposites vs the bulk theoretical predictions. That points to nano-scale incorporation helping radiation shielding mainly through microstructural refinement, not because the fundamental photon interaction mechanisms themselves have fundamentally changed.
Using narrow-beam gamma-ray transmission geometry, the linear attenuation coefficients were measured for the samples under study. The result is shown in Fig. 16. The measured values of LAC for materials of different concentrations of PbO nanoparticles were directly dependent on the density of the materials, which increased proportionally with PbO content due to the high atomic number and mass density of lead. As can be seen from the results, as the PbO concentration increases, the interaction probability of photons within the medium increases, enhancing the shielding capability. Moreover, the LAC had a typical decreasing trend with increasing photon energy due to the penetration abilities of high-energy photons and their reduced interaction cross-section. Furthermore, a sudden increase in the photon attenuation coefficient was observed at 121.8 keV, which can be attributed to the presence of the K-absorption edge of Pb occurring at 88 keV. Further, some small changes in attenuation values are caused by differences in the structure of the nanomaterial form of PbO, which can change the trajectory of the photons and thus marginally increase interaction probability on a nanoscale.
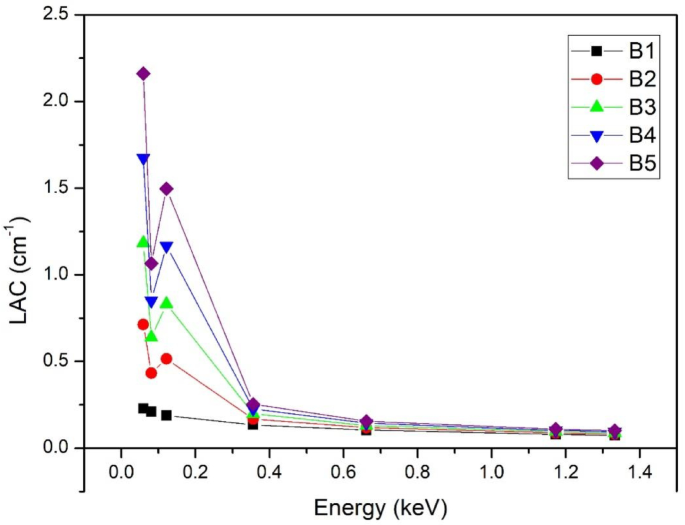
Linear attenuation coefficients for the free polymer film (B1) and nanocomposite samples with varying additive concentrations (B2, B3, B4, B5).
The performance evaluation of the manufactured plastic-based shielding materials is carried out by determining important radiation attenuation parameters, viz., half-value layer (HVL), tenth-value layer (TVL), and mean free path (MFP). These parameters are predominantly used to evaluate the capacity of any material to shield against gamma radiation. HVL and TVL are defined as the thicknesses of the material required to lower the incident gamma-ray intensity to 50% and 10%, respectively, of its original value. The MFP denotes the average distance a photon travels in the material before its interaction. Small HVL, TVL, and MFP values denote better shielding capabilities. Figures 17, 18, and 19 display how the HVL, TVL, and MFP change with photon energy for all the prepared plastic samples. In general, all three parameters increase with increasing photon energy, indicating that these higher-energy photons can penetrate the shielding material more efficiently. An exception was observed at 121.78 keV, where a sudden decrease in the HVL, TVL, and MPF values occurred for all PbO-reinforced samples, attributable to the K-absorption edge of Pb at 88 keV. Also, a significant drop in HVL, TVL, and MFP was observed for all the samples reinforced with PbO, with increasing concentration, proving a remarkable improvement in radiation attenuation.

The variation of HVL as a function of photon energy for the free polymer film (B1) and nanocomposite samples with varying additive concentrations (B2, B3, B4, B5).
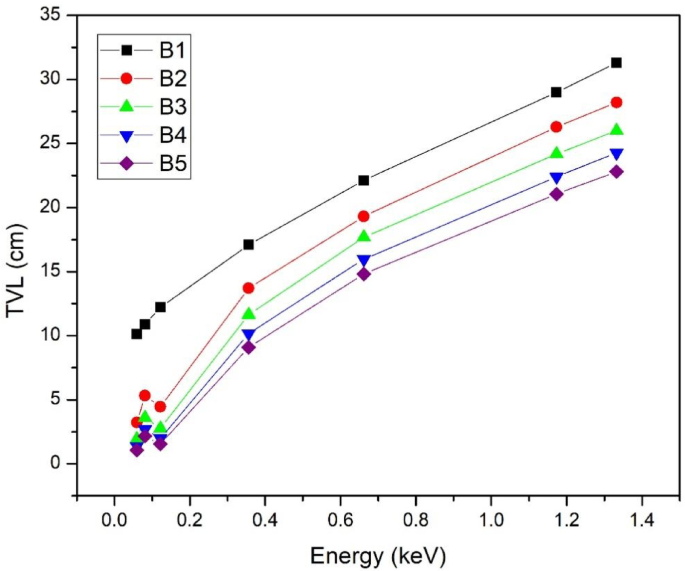
The variation of TVL as a function of photon energy for the free polymer film (B1) and nanocomposite samples with varying additive concentrations (B2, B3, B4, B5).
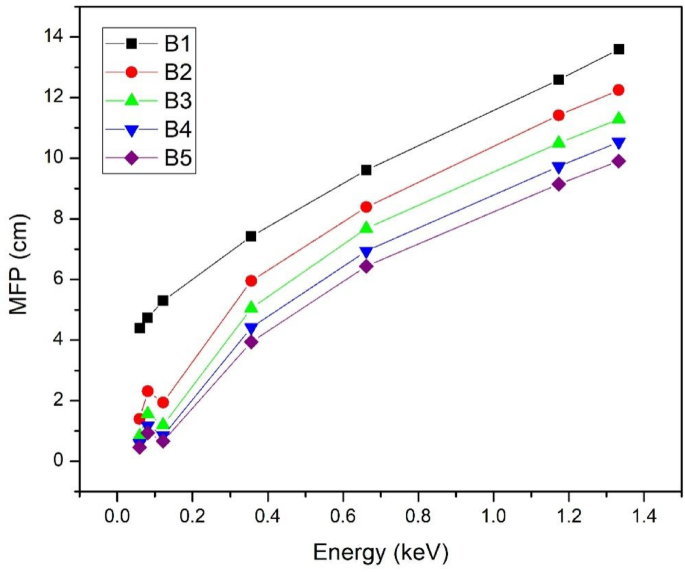
The variation of MFP as a function of photon energy for the free polymer film (B1) and nanocomposite samples with varying additive concentrations (B2, B3, B4, B5).
Table 4 shows how the linear attenuation coefficients (μ) for the prepared PVA/PVP/CMCN/citric acid/PbO nanocomposite (B5) compare with some earlier shielding materials, at photon energies 0.6617 MeV (137Cs) and 1.1732 MeV (60Co). In Table 4 it is apparent that μ tends to go down when photon energy goes up, for all of the studied materials. This happens because the chance of photon interaction becomes less at higher energy, so the radiation just passes more easily. For the B5 nanocomposite, which includes 23.53 wt.% PbO, the linear attenuation coefficients are 0.1493 and 0.1051 cm⁻1 at 0.6617 MeV and 1.1732 MeV, respectively. These numbers are noticeably larger than the coefficients reported for polyaniline, the unsaturated polyester/nanoclay/30% PbO composite, and for Poly (HEMA-co-Styrene)/30% WO₃·2H₂O at the same energies. Overall, that suggests a stronger gamma shielding behavior of the made material. Even so, barite concrete and ordinary concrete are still commonly chosen shielding options, mainly because of their high density and stable structural characteristics. Still, the B5 polymer composite manages to give competitive attenuation performance, while also bringing extra perks like less weight and easier processing. The better attenuation ability of B5 is likely linked to PbO. Lead has a high atomic number, and those Pb atoms help a lot with photon absorption and scattering effects. So, putting it together, the findings in Table 4 basically support that the PbO-reinforced polymer nanocomposite prepared here could be a suitable and promising candidate for gamma-radiation shielding uses.