Characteristics of patient rooms
Two patient rooms in the orthopedic ward at Skellefteå hospital (Skellefteå, Sweden) were selected for this study. The rooms had identical floor area (around 129 m2), orientation (south-facing windows), and number of windows (two per room). The supply and exhaust airflow were 100 l/s and 52 l/s, respectively, in both rooms. The patient rooms were Class 2 hygiene premises, specifically designed for all patient care, treatment, and reception activities. According to hygiene class 2 requirements, all interior surfaces in the room must be washable and wipeable14. Given this, cleaning in both rooms was carried out according to a daily schedule from Monday to Friday, except on Saturday and Sunday, and included wet wiping of surfaces and wet and dry mopping of the floor. To minimise environmental variability between wards, both patient wards performed the same clinical function, had the same floor area, orientation, ventilation rate, hygiene classification, and cleaning schedule and protocol throughout the study period. However, patient numbers, patient turnover, visitor frequency, and daily clinical activities were not controlled for in the study design, as observations were conducted under normal hospital conditions.
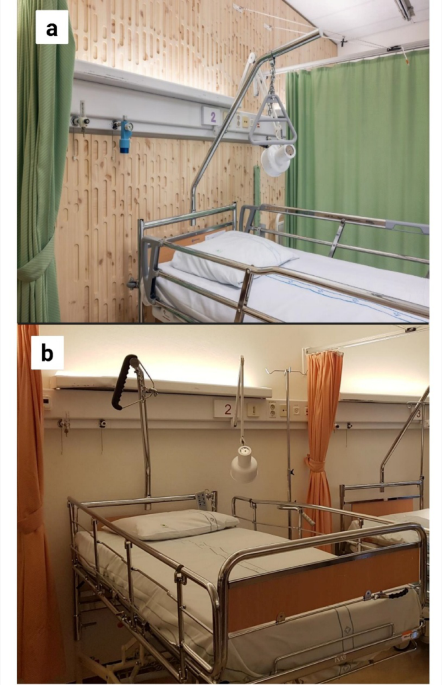
All the walls of patient rooms were covered with plasterboard with painted fiberglass. The main difference was that designer wood panels were installed on one wall in one room (hereinafter referred to as WoodW) (Fig. 1a), while the corresponding wall in the other room remained entirely painted (hereinafter referred to as PaintW) (Fig. 1b).

View of the patient rooms in which the study was conducted. (a) Room with a wood-panelled wall with a specific design pattern (WoodW). (b) Room with only painted walls (PaintW).
The wooden panels were made from three layers of Scots pine (Pinus sylvestris L.). The panels were 21 mm thick. The specific design pattern shown in Fig. 1a was produced by sawing out the 7 mm-thick top layers. In total, 0.75 m3 of Scots pine wood was installed in the WoodW patient room. Before installation, the panels were coated with a transparent, water-based fire-retardant paint NOVATHERM 1FR (Protega AB, Sweden), followed by a clear coat for sealing Top 1FR (Protega AB, Sweden). The manufacturing of the wood panels took about 15 months, with installation completed in September 2021.
Sample collection
Surface cleanliness and microbial contamination were assessed in two patient rooms (WoodW and PaintW) using ATP measurements and surface sampling by sterile cotton swabs. Since the experimental unit in this study was the patient room, multiple sampling locations within each ward and repeated sampling over time were used to characterise spatial and temporal variability within each patient room. Since the wood panels were installed in the WoodW room in September 2021, the sample collection began in October 2021 and continued every 2 months until October 2022. Throughout the entire study period, both patient rooms were in regular use for routine patient accommodation and treatment. A total of 7 measurements were carried out at this stage: October 2021, December 2021, February 2022, April 2022, May 2022, August 2022, and October 2022. At this stage, identification of the microorganisms was not carried out. Ten locations were selected for sample collection in each room (Fig. 2), namely:
-
left and right dry walls of the left window (LLW and RLW)
-
left and right dry walls of the right window (LRW and RRW)
-
left and right walls of the room, about 1.5 m from the floor (LW and RW)
-
left and right sides of the ceiling about 1 m from the walls (LC and RC)
-
wall near the ventilation channel (WVC)
-
door of the patient locker (D)

Overview of the hospital patient room with wooden wall panels (WoodW) showing the sampling sites. (a, b) General view of the right part of the patient room. (c) General view of the left part of the patient room. LLW, left (wall) of left window; RLW, right (wall) of left window; LRW, left (wall) of right window; RRW, right (wall) of right window; LW, left wall; RW, right wall; LC, left ceiling; RC, right ceiling; WVC, wall near ventilation channel; D, door of the patient locker. Sample collection in another patient room with painted walls (PaintW) is carried out at the same sites.
ATP measurement
Surface cleanliness was assessed by measuring adenosine triphosphate (ATP) levels directly in both patient rooms using a 3 M Clean-Trace™ Luminometer (Neogen, USA). The sample was collected from the surface (100 mm × 100 mm) using the one-time Clean-Trace Surface ATP Test Swab (Neogen, USA). The wet cotton swab was applied to the surface with repeated horizontal and vertical strokes, rotating the swab tip for 20 s. Following sample collection, the test was activated immediately per the manufacturer’s instructions. The ATP measurement results were displayed in relative light units (RLU). The higher RLU number indicates a more contaminated sample. The ATP benchmark for hospital surfaces was set at 100 RLU, based on previously published data15,16.
Microbial quantification measurement
Microorganisms were collected from surfaces using the swab method according to the Swedish standard SS-ISO 16000-21:201317. A sterile cotton swab was soaked in sterile distilled water and thoroughly wiped the surface (100 mm × 100 mm) for 20 s. The swabbing zones for ATP and microbial quantification measurement were located adjacent to each other but did not overlap. After collecting, the swab was then immediately transferred to a sterile tube and transported to the laboratory. Given the proximity of the hospital and the laboratory, sample transport time was approximately 30 min, and sample processing began immediately upon arrival.
A previously prepared and autoclaved (at 120 °C for 15 min) dilution buffer was added to each tube containing a swab. The buffer consisted of 0.02 M Potassium dihydrogen phosphate (VWR Chemicals, USA), 0.05 M Disodium hydrogen phosphate dehydrate (Merck KGaA, Germany), 0.074 M Sodium chloride (Sigma Aldrich, USA), 0.01% (v/v) Tween 80 (VWR Chemicals, USA), and 1000 ml distilled water. The tubes were shaken for 15 min to wash away cells and spores from the swab. Next, 1 ml of the resulting solution from each tube was transferred to a Petri dish (Ø90 mm) containing sterile malt-extract agar (MEA) (Merck KGaA, Germany) as the cultivation medium, and the solution was evenly distributed over the entire surface of each medium using the same swab. Cultivation was performed in the laboratory chamber (HPP260eco, Memmert, Germany) at 25 °C and 90% relative humidity (RH). The number of colonies on the medium surface was counted daily for 7 days. The results of microbial surface quantities were presented as the total number of Colony-Forming Units (CFU) per sample. If the number of colonies was too high to allow reliable counting by visual inspection, the CFU values were capped at 200.
Based on public recommendations, a threshold of 2.5 CFU/cm2 was used to assess the acceptable microbial quantities on hospital surfaces16,18. Given the surface area analysed (100 cm2) and the washing and inoculation methods for the samples (described above), the CFU count detected on each Petri dish represented the level of microbial contamination per 10 cm2 of surface area. For tolerably contaminated hospital surfaces, detected CFU should be no more than 25 CFU per Petri dish (or 2.5 CFU/cm2). Accordingly, if 200 CFU were detected on one Petri dish (20 CFU/cm2), the surface is highly contaminated with microbial agents.
To identify residual biodiversity of bacteria and fungi species remaining in both studied patient rooms, additional surface sampling was conducted in March 2024, approximately 2.5 years after the installation of the wooden panels in the WoodW room. The protocol for swabbing and washing was identical to that described above. The main difference was that 5 ml of the resulting solution from each tube was inoculated onto five Petri dishes with different cultivation media (1 ml per Petri dish). MEA, potato-dextrose agar (PDA) (Merck KGaA, Germany), nutrient broth agar (NA) (VWR Chemicals, USA), and dicloran 18% glycerol agar (DG 18) (Merck KGaA, Germany) were used as culture media. Subsequently, four Petri dishes containing MEA, PDA, NA, and DG 18 were cultivated in the laboratory chamber (HPP260eco, Memmert, Germany) at 25 °C and 90% RH for 7 days. Additionally, a separate laboratory chamber was used to incubate a Petri dish containing MEA with 1 ml of the resulting inoculated solution at 37 ℃ and 90% RH to detect the growth of thermophilic microorganisms. As negative controls, five Petri dishes containing the appropriate sterile media without the inoculated solution were incubated in parallel with the inoculated dishes under the same conditions.
Following the CFU enumeration, a fragment of colonies with different morphologies was transferred to separate Petri dishes (Ø 45 mm) with the appropriate medium using a sterile needle, and the cultures were further cultivated in the laboratory chamber at 25 ℃ or 37 ℃ and 90% RH for 7 days. A visual inspection for contamination was performed throughout the entire cultivation period, and additional subculturing was carried out when necessary. In this way, both bacterial and fungal pure cultures were isolated and stored at 4 ℃ in a refrigerator until further use.
All culture media were prepared in distilled water according to the manufacturer’s recommendations, then autoclaved (120 °C, 15 min) and poured into sterile plastic Petri dishes (Ø90 mm). All work was carried out in a biosafety cabinet (BSC-700II-I, HMC-Europe, Germany) to ensure aseptic conditions.
DNA extraction
To identify bacterial and fungal representatives in the WoodW and PaintW patient rooms, total genomic DNA was isolated from pure cultures. DNA extraction was performed using the CTAB protocol19,20 with minor modifications. A fragment of mycelium or bacterial colony was transferred to a 2 ml Eppendorf tube with a mixture of silica gel 60H—celite 545 (2:1) (Merck KGaA, Germany), one sterile steel ball (Ø 2.4 mm) and 500 μl of CTAB buffer (200 mM Tris–HCl, 200 mM Na-EDTA, 8.2% NaCl w/v, 2% CTAB w/v, pH 7.5 (Merck KGaA, Germany). The sample was homogenised using a homogeniser (Bead Mill MAX, VWR Chemicals, USA) at maximum speed for 1 min, then incubated at 65 °C for 1.5 h on the block heater (QBD2, Grant, USA). 500 μl chloroform (VWR Chemicals, USA) was added to each tube and mixed vigorously. The samples were then centrifuged in a micro-centrifuge (Micro Star 17R, VWR Chemicals, USA) at maximum speed for 5 min at room temperature, and the supernatant was transferred to clean tubes. The chloroform extraction step was repeated twice. A double volume of cold isopropanol was added, and the solution was left in the freezer (− 20 ℃) overnight for DNA precipitation. The next day, the mixture was centrifuged at maximum speed for 5 min at 4 ℃. The supernatant was discarded, and the formed DNA pellet was washed with 70% cold ethanol, then centrifuged at maximum speed for 5 min at 4 ℃. After removing the supernatant, the pellet was dried in a block heater at 37 ℃ until the ethanol was completely evaporated. The DNA pellet was resuspended in 50 μl TE buffer (10 mM Tris, 10 mM Na-EDTA, pH 8.0 (Merck KGaA, Germany)). DNA concentration was measured using a fluorometer (Qubit Flex, Thermo Fisher, USA) with a Qubit dsDNA BR Assay Kit (Thermo Fisher, USA) according to the manufacturer’s protocol. DNA samples were diluted to 10 ng/μl in TE buffer and stored at 4 ℃ until further analysis.
Polymerase chain reaction and Sanger sequencing
The polymerase chain reaction (PCR) was performed in a 30 μl reaction mixture using the Thermo Cycler T100 (Bio-Rad, Germany). Each reaction mixture contained 15 μl of DreamTaq PCR Master Mix (2 ×) (Thermo Fisher, USA), 10 pmol of forward and reverse primers (Merck KGaA, Germany), 10 ng genomic DNA, and nuclease-free water (Thermo Fisher, USA).
For bacterial identification, the 16S rRNA gene was used as the primary target for subsequent sequencing. Primers 27F and 1492R were used to amplify the 16S rRNA gene fragment containing the hypervariable regions (V1–V9)21,22. The PCR protocol consisted of an initial step for 5 min at 94 ℃, followed by 35 cycles of a denaturation step for 30 s at 94 ℃, a primer annealing step for 30 s at 55 ℃, and an elongation step for 1 min at 72 ℃. The final elongation was 7 min at 72 ℃.
As an additional gene for bacterial identification, the DNA gyrase subunit B (gyr B) gene was selected23,24. It was used exclusively for identifying bacteria that could not be classified to the species level using the 16S rRNA gene. Primers UP-1 and UP-2r were used for gyr B gene amplification, and primers UP-1S and UP-1Sr were used for Sanger sequencing. The PCR protocol was used as described by Yamamoto and Harayama (1995)23.
For fungal identification, PCR amplification of the Internal Transcribed Spacer (ITS) region separated by the 5.8S rRNA gene was amplified using ITS1 and ITS4 primers25,26. The PCR protocol consisted of an initial denaturation step of 2 min at 95 °C, followed by 35 cycles of a denaturation step for 45 s at 95 °C, a primer annealing step for 30 s at 55 °C, and an elongation step for 1 min at 72 °C. The final elongation was 4 min at 72 °C. The size of the target fragments varied between 450 and 600 bp.
Due to the inability to identify all fungal representatives using ITS, the β-tubulin gene was chosen as an additional marker for fungal identification27. Primers Bt2a and Bt2b were used. The amplification protocol included an initiation step for 4 min at 95 °C, followed by 35 cycles of a denaturation step for 45 s at 94 °C, a primer annealing step for 45 s at 58 °C, and an elongation step for 1 min at 72 °C. The final elongation was 6 min at 72 °C. The resulting amplicons were approximately 500 bp in length. The complete list of primers used in the study is shown in Table 1.
Amplified PCR products were visualised using a gel electrophoresis system (Bio-Rad, Germany) following the addition of SYBR Safe DNA Gel Stain (Thermo Fisher, USA). Subsequent processing was performed only for samples that contained a single target fragment. The clean-up reaction was performed using 0.5 μl Exonuclease I (Thermo Fisher, USA) and 1 μl FastAP Thermosensitive Alkaline Phosphatase (Thermo Fisher, USA) for every 5 μl of unpurified PCR product solution28. The resulting mixture was incubated for 15 min at 37 °C, then heated for another 15 min at 85 °C to inactivate enzyme activity in the Thermo Cycler T100 (Bio-Rad, Germany). The concentration of pure amplified fragments was determined using a fluorometer (Qubit Flex, Thermo Fisher, USA) with a Qubit dsDNA BR Assay Kit (Thermo Fisher, USA) according to the manufacturer’s protocol. The purified PCR products were stored in a fridge at 4 ℃.
Sanger sequencing of all samples was performed using Macrogen Europe services (Amsterdam, Netherlands; https://www.macrogen-europe.com/). Before shipping, the concentration was adjusted to 10–20 ng/μl using nuclease-free water (Thermo Fisher, USA) according to the provided recommendations.
Bioinformatics and statistical data analysis
All ATP and CFU data collected over a study period (Oct-21, Dec-21, Feb-22, Apr-22, May-22, Aug-22, Oct-22), as well as data from the additional sampling in March 2024, were analysed. The Shapiro–Wilk test was used to assess the normality of the distributions of the obtained RLU and CFU data. Calculated W and p-value show how closely the data follow a normal distribution. If W is close to 1, the data are normally distributed. If W is around 0.9, some deviated data are present. W < 0.85 indicates strong deviation from normality. p-values > 0.05 indicate that the data are normally distributed; p-values ≤ 0.05 indicate that the data are not normally distributed.
The median, first quartile (Q1), third quartile (Q3), interquartile range (IQR), and ranges of RLU values and CFU counts were calculated. Total CFU count was calculated for each time point, and a heat map was generated. To assess surface ATP levels, box plots of RLU values for each time point were created for each room. On boxplots, outliers were defined as values exceeding 1.5 times the IQR above Q3 or below Q1.
To assess the strength and direction of association between ATP levels and microbial quantities in WoodW and PaintW rooms separately, non-parametric Spearman’s rank correlation coefficient (ρ) was calculated, and scatter plots were generated. If the ρ coefficient ranges from 0 to 1, it indicates a positive correlation between the two variables. If ρ is 0, there is no correlation, and if ρ varies from − 1 to 0, variables are inversely related29,30. All statistical analyses and visualisations were performed in Python 3.14.0 using the matplotlib, seaborn, pandas, scipy and numpy libraries31,32,33.
DNA sequences obtained in this study were compared with the GenBank database at the National Center for Biotechnology Information (NCBI) using the Basic Local Alignment Search Tool (BLAST) software on the NCBI website (http://www.ncbi.nlm.nih.gov/BLAST/) to identify their taxonomic affiliation34. The mandatory criteria were sequence coverage > 80%, species-level similarity between sequences of 98–100%, and genus-level similarity of 94–97%. With similarity < 94%, the organism was classified as an unknown fungus or bacterium35. The obtained sequences were submitted to GenBank under accession numbers PX917402-PX917429, PX917474-PX917488.
A four-level Risk Group (RG) classification was used to identify bacteria and fungi as potential etiological agents of human diseases. These levels are based on the intrinsic virulence of microorganisms and routes of infection20,36.
-
RG1—bacteria and fungi with low individual and community risk
-
RG2—have moderate individual risk and limited community risk, are opportunistic human pathogens.
-
RG3—have high individual risk and low community risk and usually cause bacterial diseases or mycoses.
-
RG4—bacteria with high individual and community risk usually produce serious human diseases. Not used for fungi.
The RG of all identified bacteria was determined according to the German technical rule TRBA 46637, and of fungi according to the information provided in the Atlas of Clinical Fungi20.
To estimate the relative abundance of detected bacterial and fungal taxa, the proportion was calculated based on the number of colonies of each identified bacterial/fungal species per Petri dish.
A Venn diagram was constructed to visualise the shared and unique taxonomic units identified in WoodW and PaintW rooms. The presence/absence of each taxonomic unit was taken into account. The diagram was visualized using the matplotlib-venn library in Python 3.14.038. In addition, the Jaccard Index was calculated to assess the similarity of microbial community between two locations based on the presence/absence of identified taxonomic units. The index ranges from 0 (completely distinct communities) to 1 (identical communities)39. The calculation was performed in Python 3.14.0 using the pandas library33.
Phylogenetic analysis was performed using the Maximum Likelihood method with 1000 bootstrap replicates in MEGA 1240, with preliminary multiple sequence alignment using the ClustalW package41. The iTOL tool provided a visualisation of phylogenetic trees42.