Catalyst evolution during electrolysis
Stages 1 and 2 (see “Methods”/Fig. S4) were performed to evaluate the potential dependent evolution of the electrocatalyst’s structure. Here, the open circuit potential OCP1 was performed in stage 1, followed by chronoamperometry (CA) measurements with increasing potentials in stage 2. Figure 2a depicts the Raman spectra of the IrOx OER catalyst as a function of applied cell potential. At OCP1, the IrOx Raman signature is characterized by an intense main feature between 400 and 800 cm−1 and two smaller bands at approximately 180 and 310 cm−1. The main feature itself consists of three features centered at 500, 600, and 710 cm−1. The main feature broadens considerably at a cell potential of 0.4 V, resulting in significant overlap between the spectral features, which were observable as distinct shoulders at 500 and 600 cm−1 up to this point. This broadening causes a significant intensity increase at 370 cm−1. Furthermore, the shoulder located at 710 cm−1 is redshifting at this cell potential, merging further into the main feature.

Raman potential series of an iridium oxide-based commercial PEM anode (a). Geometrical current density at the applied potential (b). The current density was calculated from the last measured current for each potential. Raman spectra during stages 4–6 (c).
This trend continues at 0.6 V, finally resulting in a very broad feature with multiple shoulders, but no distinct components at a cell potential of 0.8 V. No significant changes occur with further increase of the cell potential, until 1.4 V, where the left tail of the feature between 200 and 400 cm−1 decreases significantly in intensity, which, however, increases to previous levels at 1.5 V. The spectrum is constant until the maximum applied potential of 2.2 V.
The geometrical current density as a function of cell potential is depicted in Fig. 2b. As indicated by the significant current response starting between 1.5 and 1.6 V, the start of the OER is evident. The changes in the Raman spectra correlate with the current increase between 0.4 and 1.5 V, and no further changes occur as soon as the OER starts.
The potential dependent Raman signature overall matches the experiments of Pavlovic and Saeed, however, with slight deviations12,13,33. In alkaline conditions, signal η occurs at 813 cm−1 during the OER and scales with the anodic current. Due to the acidic conditions in PEMWE, this signal is absent. Saeed et al. observed an additional signal ζ at 773 cm−1 occurring concertedly with α, which was assigned to a blue-shifted Ir4+-O-Ir4+ stretching vibration12. This signal is also absent in the recorded in operando spectra. The ζ signal may be associated with surface species inaccessible in acidic conditions or may be only stable over the short time scale in which the SHINERS measurements were performed. It is also plausible that enhanced sensitivity due to the use of SHINERS enabled the observation of this signal. Furthermore, it is evident that the changes in the spectra are mostly completed at significantly lower potentials than the OER onset. In the previous studies, significant changes occurred up until the OER12,13,33.
Catalyst relaxation
Stages 3 and 4 were performed to reset the catalyst’s state after the potential series in stage 2 in preparation for the next experiments. Both consist of a cyclic voltammetry (CV) experiment followed by an OCP experiment (see “Methods”/Fig. S4). Potential cycling has been reported to reactivate IrOx catalysts by hydration and reduction of condensed IrO2 phases14,38,39. Cycling to 0.0 V at the end of the CV1 and CV2 is done to reduce higher iridium oxidation states. The OCP experiments after the CVs were performed to allow the catalyst to relax into an equilibrium state before continuing with stage 5. The Raman spectra of the OCP steps are displayed in Fig. S10. At OCP2 after the first cycling step, an overall shift of the IrOx main feature to higher wavenumbers is visible compared to the pristine sample, suggesting an increased ratio of Ir3+ species. At OCP3, following the second potential cycling step, the Raman spectrum closely resembles that of the pristine catalyst, indicating that the starting conditions of stage 5 are sufficiently comparable to those of stage 1.
After resetting the catalyst, further experiments were performed to observe the relaxation of the catalyst after the OER. The respective Raman spectra recorded in stages 4–6 are displayed in Fig. 2c. During OCP3, the Raman spectrum is comparable to the catalyst’s initial state in stage 1, indicating that it is reset to its pre-OER state by the combination of potential cycling and OCP. Stage 5 started with the application of 1.0 V cell potential for 50 min, resulting in no significant change in the spectra at a current density of 0.016 mA cm−2. Increase of the cell potential to 2.0 V for 60 min resulted in a significant electrolysis current density of 4.4 mA cm−2 and similar changes in the Raman spectra as already observed in the previous potential series. The electrochemical bias was removed with the start of OCP4, allowing relaxation of the catalyst. After 15 h of OCP4, the Raman spectrum exhibits a blueshift of the center of mass for the broad IrOx band. Additionally, the peak at 310 cm−1 is significantly more pronounced compared to OCP3 in stage 4 and the CA measurements in stage 5. After an additional 24 h of OCP in stage 6, the Raman spectrum returned close to the initial state.
Deconvolution of the in operando Raman spectra
In order to study the evolution of each component of the Raman spectra, various fitting models were derived based on peak assignments from the Raman studies mentioned earlier12,13,33 and implemented for deconvolution of the spectra utilizing a custom Python script. The fitting procedure was performed 10 times with slight random variations of the fitting parameters for each spectrum in order to evaluate the stability of the fitting model. The exact fitting procedure is described in the methods section.
The fitting model was developed iteratively, based on and expanded upon previous works described in the introduction. In particular, the developed model takes into account the Eg band of crystalline IrO2 and two additional peaks to reflect the spectral changes through variation of peak amplitudes instead of shifting the peak positions of γ and ε. The detailed process of development of the fitting model is described in the supplementary information. The final model considers 7 peaks for the IrOx Raman signature and one peak representing the Eg band of IrO2. Representative spectra and their respective fits are displayed in Fig. 3a–c.

Spectral analysis of the in operando experiment. Fits of Raman spectra at OCP1 (before potential series) (a) at 2.2 V (end of potential series) (b), and at OCP4 (during catalyst relaxation) (c). Fitting was done using a model consisting of 7 Pseudo-Voigt peaks for IrOx-related signals, as well as one Pseudo-Voigt peak for the IrO2 Eg band. Peak amplitudes from deconvolution of the spectra for the respective applied potentials and OCPs (d). Peaks related to IrO2 (top); Peaks assigned to species with higher oxidative charge (middle); Peaks assigned to Ir4+-O-Ir4+ and Ir4+-O-Ir3+ vibrations (bottom). Values are averaged over 10 runs of the fitting procedure with randomly varied starting parameters. Synchronous correlation spectrum of stages 1–2 of the in operando series (e). Positive values are depicted in red, negative values are depicted in blue. Peak positions as determined from the synchronous correlation spectrum are depicted using colored vertical and horizontal lines. Fits of all spectra are depicted in Fig. S14.
As illustrated in Fig. 3d, the Eg band amplitude drops upon potential increase between 0.2 and 0.8 V, indicating an amorphization of the electrocatalyst as the OER potential is approached. Additionally, it is evident that the evolution of the ε amplitude is correlated with Eg. These findings indicate that the ε band could be related to IrO2 instead of amorphous IrOx. This assumption is supported by the fact that the Raman shift of the ε band matches that of a convoluted peak of broadened and overlapping IrO2 A1g and B2g bands. Furthermore, the bimodal formation of peaks evident from the DFT calculations of the Ir4+ trimer performed by Pavlovic et al. is significantly more narrowly distributed than the experimentally observed signals γ and ε13. The lower shift of the experimentally observed Eg band compared to literature40 can be understood by the implementation of IrO2 crystals in an amorphous IrOx matrix, which may affect the force constants of the IrO2 vibrations due to mechanical influences41,42. Bands β, θ, and ι are characterized by their increasing amplitudes with rising potential up to the start of the OER. While the concerted appearance of bands β and θ has been reported by Saeed et al.12, the additional ι peak exhibits a very similar trend, indicating that they are related to the same species. Based on the previous literature and the increase in amplitude, increasing potential up to the OER, these peaks are assigned to charged IrOx structures. After OER onset at 1.5 V, β, θ, and ι generally remain at constant values. The δ band decreases gradually over the potential increase up to 2.2 V, while γ exhibits an increase of about 10% in amplitude for the potential range from 0.2 to 0.4 V, followed by a gradual decrease comparable to the δ band. This indicates that both species are consumed for the formation of species associated with the β, θ, and ι bands up to the OER onset. Therefore, signal δ and γ are assigned to Ir3+ and Ir4+ species, respectively, which is in line with literature12,13,33. Component α does not exhibit significant potential-dependent behavior. A prominent change in peak amplitudes is observed at 1.4 V, where the spectrum exhibits anomalously reduced intensities below 500 cm−1 compared to adjacent potentials. This is attributed to a shift in optical parameters at the onset of gas bubble formation rather than a meaningful change in catalyst structure. As the fitting procedure uses parameters from each spectrum as starting values for the next, this local deviation propagates into subsequent fits, as evidenced by the elevated standard deviation of the θ amplitude at higher potentials. The apparent increase in θ amplitude is therefore considered a fitting artifact and is not interpreted as a change in catalyst oxidation state.
In stages 4–5, no significant changes in peak amplitudes are observed upon increasing the potential to 1.0 V from OCP. This contrasts with the behavior observed in stage 1, where significant spectral changes occurred below 0.8 V, and is likely attributed to the shorter and less gradual potential protocol, which does not allow sufficient time for the catalyst to structurally adapt to the applied bias. An amplitude decrease for the Eg and ε bands is observed upon stepping to 2.0 V from OCP3, similar to the behavior in stages 1–2. In stage 6, 15 h after the start of OCP4, both components revert to their respective amplitudes at OCP1. The β, θ, and ι bands exhibit a similar trend to that seen in stage 2. This is further supported by the XRD data of the pristine and operated samples, displaying no significant differences in the iridium oxide reflexes (Fig. S6).
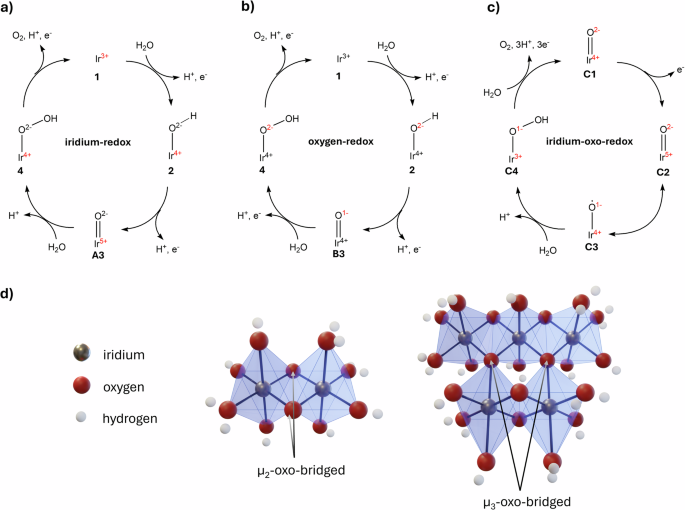
A prominent evolution occurs for the δ band, which exhibits a significant spike in amplitude at OCP4 in stage 6, even surpassing its initial value in stage 1. The open circuit conditions after shutdown of the cell might facilitate the decomposition of the hydroperoxo-species (4/C4, Fig. 1) without electron transfer. This might result in the formation of an Ir3+-OH species as depicted in Fig. 4, explaining the high amplitude of δ at OCP4.

Decomposition of iridium-hydroperoxo species into Ir3+. Decomposition of species 4 in the iridium-redox and oxygen-redox cycles (a); Decomposition of species C4 in the iridium-oxo-redox cycle (b).
The γ band intensity drops by almost 50% with the increase from 1.0 to 2.0 V and only slowly regains it over the next 40 h in OCP4 and OCP5. It is evident that the electrocatalyst exhibited lower Ir3+ concentrations at OCP3 in stage 4 compared to stage 1. The lower Ir3+ starting concentration potentially results in slower Ir4+ formation by oxidation of Ir3+ during the potential increase in stage 5. In turn, the formation of Ir4+ is too slow to compensate for the higher reaction rate of Ir4.x+ formation from Ir4+ at elevated potentials, resulting in the low amplitude of the γ signal at 2.0 V. Generally, at OCP5, all amplitudes approach the values found for the pristine catalyst at OCP1, indicating that the transformations of the catalyst are reversible.
Supplementary to this fitting procedure, two-dimensional correlation analysis was performed with the data of stages 1 and 2. The method, which was pioneered by Noda43, allows for correlational analysis of dynamic spectra of a system under any type of perturbation. In this case, an electrochemical perturbation is employed, resulting in dynamic, potential-dependent Raman spectra. The correlational analysis results in a visual representation of the correlation between two spectral positions under perturbation, essentially deconvoluting spectral signatures consisting of correlating overlapping signals. Compared to the previously discussed fitting procedure, this is a model-free analysis approach, free from human bias.
Utilizing Eqs 2 and 3 (see “Methods”), the correlation spectra were computed for stages 1 and 2 of the in operando Raman series. In the synchronous spectrum (Fig. 3e), changes in intensity occurring synchronously between two peaks along the potential axis are shown. Positive values are the result of two peaks which increase or decrease concertedly with the potential, and negative values occur if one peak increases while the other one decreases in intensity. The diagonal peaks naturally exhibit positive values as they show the correlation of one peak with itself. Overall, diagonal and cross peaks are visible in the synchronous spectrum at Raman shifts close to the positions of the peaks that were used for the expanded fitting procedure. Peaks α and β show up as shoulders of the ι peak, and the Eg peak shows as a shoulder of the γ peak. The intensity changes of the peaks with potential are also reflected very well in the synchronous spectrum. Peaks β, θ, and ι show positive cross peaks with each other and negative cross peaks with peaks γ, Eg, δ, and ε, and vice versa. This reflects the observation from the utilized fitting model where β, θ, and ι, and γ, Eg, δ, and ε demonstrate the same correlated behavior. Overall, the results of the two-dimensional correlation analysis strongly support the implementation of eight peaks for the fitting model and their Raman shifts.