Experimental animals
Male S100a9 knockout (KO) mice aged 6–8 weeks and weighing 22–25 g were purchased from the Model Organisms Center (Shanghai, China). Male C57BL/6 mice aged 6–8 weeks and weighing 22–25 g were purchased from Vital River Laboratory Animal Technology Co. (Zhejiang, China). Mice were housed in standard cages in a room at 23 °C and 50% relative humidity on a 12-h light:12-h dark cycle. Mice in both denervated groups were anaesthetized and subjected to unilateral sciatic nerve transection23. Briefly, after deep anaesthetization, a 0.5-cm-long portion of the sciatic nerve in the right hind leg of each mouse was resected; the two nerve ends were buried in the muscles, and the incision was closed using 4–0 absorbable sutures. The mice were randomly assigned to experimental groups for analysis at specific time points after denervation.
Mice were subjected to sciatic-nerve transection under isoflurane anaesthesia. Denervated muscles (gastrocnemius) and contralateral controls were harvested at 3 h, 6 h, 12 h, 1 day, 3 days and 7 days post-surgery (n = 4–6 per group). Tissue samples for RNA sequencing (6-h time point) were flash-frozen in liquid nitrogen, whereas samples for histology (at 3-h, 6-h, 12-h, 1-day, 3-day and 7-day time points) were fixed in 4% paraformaldehyde. Tissue samples for flow testing (3-day and 7-day time points) were placed in muscle-tissue culture medium.
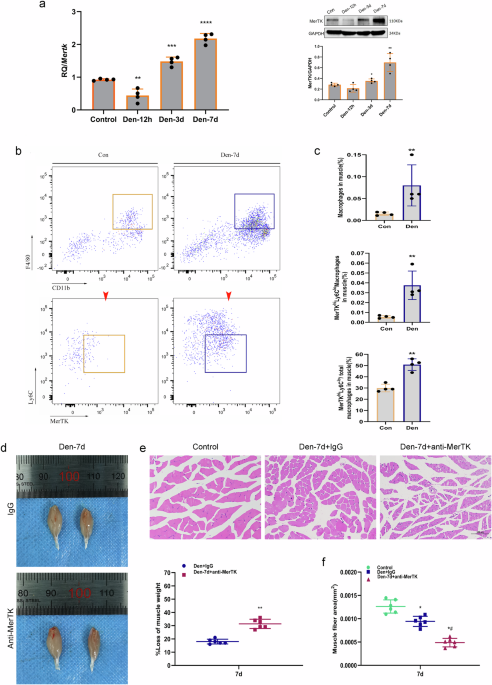
Mice were randomly assigned to control, Den-7d+lgG or Den-7d+anti-MerTK groups (n = 6 per group). Mice were given 2.0 mg/kg intravenous polyclonal goat anti-MerTK antibody 1 h before denervation.
The animal study was reviewed and approved by the Institutional Animal Care and Use Committee of Huashan Hospital, Fudan University.
Flow cytometry
For cell preparation and sorting, please refer to the supporting information. FVS dye (1 μl) was added to a suspension of single cells (1 ml; 3×10⁶ cells) slowly and evenly using a liquid transfer gun, and the suspension was then incubated at room temperature away from light for 30 min. Next, 3 ml of PBS was added to resuspend the cells, and the sample was centrifuged at 4 °C at 400 × g for 5 min, after which the supernatant was discarded. The cells were resuspended in PBS and then incubated with 5 μl of CD45-APC-Cy7, Ly6G-PE, CD11b-FITC, CD115-Pecpcy5, SCA-1-APC/AF647, c-Kit-PE, CD48-PE-CY7, CD150-BV605, Mer-BV421 and Ly6c-AF700 at room temperature in the absence of light. After incubation, 3 ml of PBS was added to resuspend the sample, which was centrifuged at 4 °C at 400 × g for 5 min, and the supernatant was discarded. Prior to detection, 200 μl of PBS was added to each tube. The data were analysed using FlowJo software.
RNA sequencing
Total RNA was extracted from muscle-tissue samples using the miRNA Isolation Kit (mirVana; Thermo Fisher Scientific, Waltham, MA, USA; AM1561) according to the manufacturer’s protocol. The RNA integrity was evaluated using the Agilent 2100 Bioanalyzer (Agilent Technologies, Santa Clara, CA, USA), and samples with an RNA integrity number ≥ 6 were retained for analysis. Then, the libraries were constructed using the TruSeq Stranded messenger RNA (mRNA) LT Sample Prep Kit (Illumina, San Diego, CA, USA) according to the manufacturer’s instructions and sequenced on the Illumina HiSeq X Ten platform, generating 125/150-bp paired-end reads. Index-coded sample clustering was performed using the TruSeqPE Cluster Kit v3-cBot-HS (Illumina) on a cBot Cluster Generation System according to the manufacturer’s protocol. The Illumina HiSeq X platform was used to sequence the library preparations; 125-/150-bp paired-end reads and 50-bp single-end reads were generated. For other detailed methods, please refer to the supporting information. DEGs were identified using DESeq2 with thresholds of false discovery rate (FDR)-adjusted P < 0.05 and |log2(fold change)| ≥ 1. Raw P values were corrected for multiple testing using the Benjamini–Hochberg (FDR) method.
Wet weight
At different time points after denervation, mice were anaesthetized, and the gastrocnemius muscles of both the left and right hind legs were removed, washed with saline and then weighed. The ratio of muscle weight loss was defined as the weight of the contralateral side minus the muscle weight of the nerve injury side divided by the weight of the contralateral side. The muscle samples were stored in 4% paraformaldehyde at −80 °C until use.
Quantitative real-time PCR
The RNeasy kit (Qiagen, Valencia, CA, USA) was used to extract total RNA from the gastrocnemius muscle. The cDNA was synthesized by a first-strand cDNA synthesis kit with oligo dT primers (Invitrogen, Carlsbad, CA, USA) and was used for quantitative real-time PCR (MJ Research, Waltham, MA, USA). The thermal cycling conditions were as follows: 94 °C for 5 min; 35 cycles at 94 °C for 30 s, 55 °C for 45 s and 72 °C for 1 min; and 72 °C for 5 min. The relative expression level of the target gene was calculated by using the cycle threshold (Ct) value. The expression levels of S100a8, S100a9, Trim63, Fbxo32 and Nr4a1 were normalized to GAPDH levels. The primer sequences were as follows: S100a8: R, 5’- ATG CCA CAC CCA CTT TTA T-3’, F, 5’-ATG CCC TCT ACA AGA ATG ACT-3’; S100a9: R, 5’-CAT CTG AGA AGG TGC TTT GTT-3’, F, 5’-CTG GGC TTA CAC TGC TCT TAC-3’; Trim63: R, 5’-CCA TCA GGA ATC AGG CTA GA-3’, F, 5’-GTC AGG GGA CGA AGA CAA A-3’; Fbxo32: R, 5’-CTT CCC CCA AAG TAC AGT ATC-3’, F, 5’-GAG AAA GAA AGA CAT TCA GAA CA-3’; Nr4a1: R, 5’-ATC TCA ACC TCT TCC TTT CTG TA-3’, F, 5’-GTG ACC CCA CTA TTT GTC TTA TC-3’; Mertk: R, 5’-CTC CCG TTG AGA AAA GTT G-3’, F, 5’-CTG GAA GAT GTT GTG ATT GAC-3’; GAPDH: R, 5’-TGC CGT GAG TGG AGT CAT AC-3’, F, 5’-CCC GTA GAC AAA ATG GTG AA-3’.
Western blot analysis
The frozen gastrocnemius muscle samples were homogenized in a radioimmunoprecipitation assay buffer containing 1 mM phenylmethylsulphonyl fluoride and the Protease Inhibitor Cocktail (Roche Applied Science). The lysates were centrifuged for 20 min at 12,000 × g (4 °C), and the protein level in the supernatant was quantified with a bicinchoninic acid assay kit (Beyotime). The proteins were separated by SDS–PAGE (Beyotime) and transferred to a polyvinylidene difluoride membrane (Beyotime) that was blocked with 5% non-fat dry milk in Tris-buffered saline at room temperature, followed by incubation with primary antibodies: mouse anti-MerTK (1:1000; Abcam, USA). After being washed three times, the membrane was incubated with the appropriate secondary antibody (Abcam) at room temperature for 1 h. The enhanced chemiluminescence detection reagent and an X-ray film were used to visualize the proteins.
Immunohistochemistry
The expressions of the S100A8 and S100A9 in the gastrocnemius muscle were detected by immunohistochemistry. The sections were deparaffinized with xylene and rehydrated with ethanol, and antigen retrieval was performed in a 0.01 M citrate buffer (pH 6.0) in a pressure cooker, followed by natural cooling to room temperature. The sections were incubated in 0.3% hydrogen peroxide at room temperature for 10 min; goat serum was used to block the sections for 15 min at room temperature, and they were then incubated overnight at 4 °C with rabbit anti-S100A8 (1:100; Abcam, ab180735, UK) and rabbit anti-S100A9 (1:100; Abcam, ab92507, UK). This was followed by treatment with horseradish peroxidase-conjugated goat anti-rabbit IgG antibody (ABclonal, 33301ES60, Wuhan, China) for 30 min at room temperature. Immunodetection was performed by using a diaminobenzidine solution according to the manufacturer’s instructions. After being washed, the sections were counterstained, dehydrated and then coverslipped by using neutral gum sealant. Immunohistochemistry analysis was performed on 4 mice per group, with 3 tissue sections per mouse.
Immunofluorescence
To identify the S100A8, S100A9, CD11b, Ly6G and F4/80 in the denervated muscles, double immunostaining was performed. The paraformaldehyde-fixed denervated muscles were incubated with the primary antibody followed by the secondary antibody and were subsequently mounted with DAPI. The primary antibodies included mouse anti-Ly6G (1:50; Santa, USA), rabbit anti-S100a8 (1:50; Abcam, ab180735, UK), rabbit anti-S100A9 (1:50; Abcam, ab92507, UK), rabbit anti-CD11b (1:200; Abcam, ab52632, UK) and rabbit anti-F4/80 (1:200; Santa, 28463-1-AP, USA). The number of positive cells was observed by fluorescence microscopy (1 × 71; Olympus, Japan) and quantified by Image J software. Tissues were harvested and processed for immunofluorescence imaging at 12 h post-treatment. Image acquisition parameters (e.g. exposure time, magnification) were standardized across all samples to ensure comparability.
Haematoxylin–eosin staining
Gastrocnemius muscle samples from mice were fixed in 4% paraformaldehyde and embedded in paraffin. The samples were cut at a thickness of 5 µm, and the sections were stained with haematoxylin–eosin (Beyotime, Shanghai, China) to evaluate histopathological changes. The mean area, diameter and density of myofibres were determined by blinded analysis using Image-Pro Plus 6.0 software (National Institutes of Health, Bethesda, MD, USA) from six randomly captured images per mouse under each experimental condition. An EclipseCi-L camera microscope was used to select the target area of the tissue for ×400 imaging so that the tissue could fill the whole field of view as much as possible to ensure that the background light of each photo was consistent. After completion of imaging, Image-Pro Plus 6.0 analysis software was used to count the number of muscle fibres in three visual fields in each slice (mm²), to measure the diameter of five muscle fibres (mm), and to calculate the average muscle fibre area (mm²) (equal to the total area of muscle fibres/number of muscle fibres) and the muscle fibre density (equal to the number of muscle fibres/area of the visual field).
Statistical analysis
Measurement variables are presented as the mean ± standard error of the mean (SEM), and categorical variables are presented as percentages. Differences between two groups were evaluated using the Chi-squared test. For comparisons among multiple groups, one-way analysis of variance (ANOVA) tests was conducted. Differences at different time points were evaluated by using the Friedman test. Statistical analyses were performed using SPSS software, v17.0 (SPSS Inc., Chicago, IL, USA). P values < 0.05 were considered statistically significant. Pathway enrichment analysis was performed and P values were adjusted for multiple testing via the Benjamini–Hochberg FDR method. Pathways with FDR-adjusted P < 0.05 were considered statistically significant.